Sports Alert does not currently provide xG charts. This is a guide to reading the ones that other data providers and analytics sites publish, so that you can read them well wherever you find them.
A scoreline can hide the match underneath it. A team can lead 1-0 after one low-probability finish while the other side has created the better chances. Expected goals, or xG, is one way of putting a number on that difference, and a chart of it over time shows when the chances arrived.
What xG measures, and who measures it
Expected goals rates the quality of a chance: the likelihood that a shot becomes a goal, judged from similar shots taken in the past. Each shot gets a value between 0, a chance that could not be scored, and 1, a chance that would be scored every time. Adding a team’s shot values together gives a total that says roughly how many goals its chances should have produced on average.
The value is an estimate from a model, and models differ. Opta describes using more than 20 variables, including distance and angle to goal, the goalkeeper’s position, defensive pressure and the type of shot and the kind of play it came from. StatsBomb describes xG as a model’s estimate of the number of goals that would have been scored, on average, from a situation, and notes that models can differ widely in how much data they use and how they use it. A peer-reviewed study makes the same point: some xG models use only event data, while others add the positions of players on the pitch. So the same match can show different xG totals on two different sites, and neither is simply wrong.
What a cumulative xG chart shows
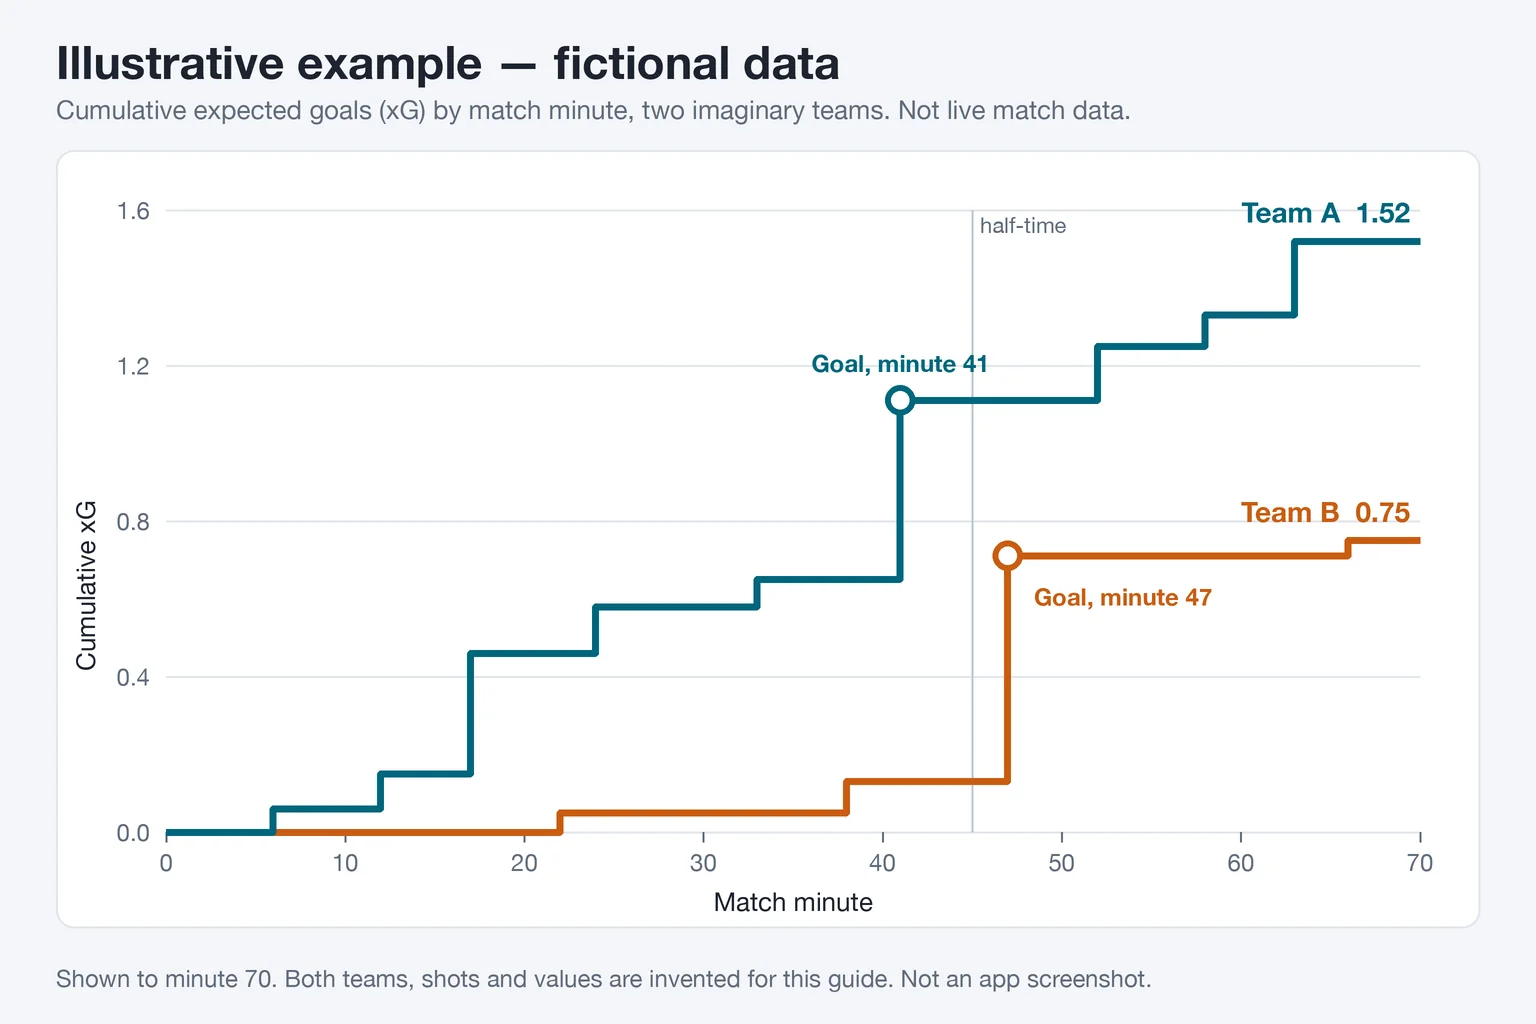
A common form is a step chart. Match time runs along the horizontal axis and cumulative xG up the vertical axis, with one line per team. Each time a team takes a shot its line steps up by that shot’s xG value, so a big step means a good chance and a tiny step means a speculative one. Goals are often marked on the line. Some charting tools leave penalties and own goals out of the totals, so check what a particular chart includes.
The illustration at the top uses invented numbers for two imaginary teams. Both lines are drawn to minute 70, with one goal marked for each. It is there to show the shape of a chart, nothing more, and it is not live data from any match.
Reading it: the gap, then the shape
Start with the gap between the lines, then ask how it was built. In the illustration, Team A has 1.52 xG by minute 70 against Team B’s 0.75. A gap that size looks decisive, but the shape matters. Team A’s total comes from nine separate steps, the largest of them 0.46, so it reflects a steady stream of shots. Team B’s 0.75 includes a single step of 0.58, and without it Team B would be on 0.17.
That contrast is why one number is a poor summary. A single large step, such as a penalty, can move a line a long way on its own, because providers rate a penalty as a very high-value chance. Several smaller steps in a short stretch suggest repeated shooting chances, though no chart can show you how the move was built or what the defence was doing.
Timing matters too. The same total after 20 minutes and after 80 minutes describes a very different amount of match, and a gap that opened in one burst may say less about the rest of the match than a gap that grew gradually.
When the scoreline and the chart disagree
The score is the result and xG is the evidence about how it came about. When they point the same way there is little to explain. When they diverge, the divergence is the interesting part. In the illustration the score is 1-1 although Team A has more than twice Team B’s xG. Possible reasons include good finishing by one side, a strong save, a shot that took a deflection, or simply that football is a low-scoring game in which a few chances decide the result.
What the divergence does not mean is that a goal is due. xG describes the chances that have already happened. Opta says that a higher xG total in a match does not necessarily mean a team should have won, because xG measures chance quality, not the expected outcome of the game. Stats Perform says xG does not directly predict match results, though over time teams with higher xG tend to score more. Opta’s explainer also calls the belief that a team must now fall back after overperforming its xG the Gambler’s Fallacy, because those shots have already happened. The same logic applies the other way: a team that is behind its xG has not built up a debt that its next shot repays.
What an xG chart does not tell you
- Who played better overall. It records shots. It does not record every contribution to a match, and it does not explain why a side was creating or conceding chances.
- What happens next. A chart is a record of the past. Over many matches teams with higher xG tend to score more, but one chart does not tell you who will score next or who will win. The same advantage after 30 minutes and after 85 minutes leaves very different time for anything to change.
- The exact value of any one chance. Each value is a model’s estimate and no model predicts every shot correctly. Variation from the expected value is normal, as Opta’s own explainer notes.
- The reason for a swing. A red card, a substitution or a change of approach may sit behind a rise in one line. The chart will not say, so check the match itself.
Questions to ask before trusting a number
Which provider and which model produced it? Does the chart include penalties and own goals? Are you looking at one match or many? Is the figure being used to describe the chances a team created, which is what it measures, or to call the result of this match, which it does not do directly? Treat xG as one input next to the scoreline, the minute and what you can see of the match, and expect a different site to give a somewhat different number.
Where Sports Alert fits, and where it does not
Sports Alert does not provide xG charts or an xG timeline. Its alerts are rules that watch match events and statistics, such as shots on target, corners and cards, and tell you when a rule is met. An alert is a prompt to look at a match, not a promise about what happens next. If you want to read chance quality, use a chart from a data provider and apply the checks above.
Sources
- Opta Analyst, What Is Expected Goals (xG)?
- Stats Perform, Expected Goals (xG): The Football Metric Changing Analysis, Betting, and Fan Engagement
- StatsBomb, Upgrading Expected Goals
- soccermatics (open-source charting package), soccerxGTimeline documentation
- Frontiers in Sports and Active Living (2021), A Goal Scoring Probability Model for Shots Based on Synchronized Positional and Event Data in Football (Soccer)
Follow the Matches You Care About
Create an account to follow live matches and explore the alerts available on your plan.
Create Free AccountThis content is for informational and entertainment purposes only. Sports Alert provides match analysis based on statistical models and threshold rules. It is not betting advice, not financial guidance, and carries no guarantee of future outcomes. For more information, please see our Disclaimer.